
Custom dashboards Next
Describe the dashboard. MIE builds it.
No more requests passed from manager to junior to product team, and no more exported sheets. Ask for the view you need and it appears in your MIE menu, built on live plant data.
mie.thinklytixai.com/trends
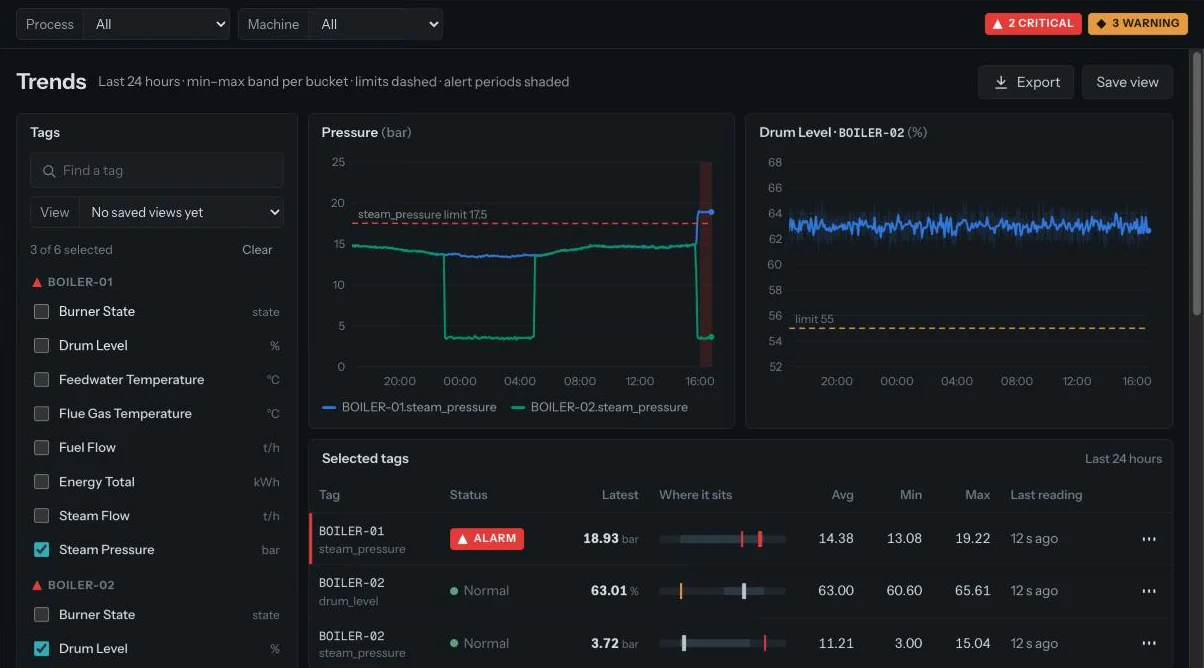
Days to minutes
The usual way costs days. This takes minutes.
The usual way
- Manager asks a junior
- Junior writes it up for the product team
- Team exports sheets and builds a chart
- A link arrives days later
With MIE
- Ask in plain English
- Review the draft
- Pinned to your menu
How it works for you
Ask, review, keep.
Ask
"Weekly dashboard for Line 1: output vs target by day, downtime by machine, energy per unit."
Review
MIE drafts the panels. Change anything by asking: "make downtime a bar chart", "last 30 days".
Keep
Save it under Custom dashboards. Share it inside your company, pin it to wall mode or schedule it as a PDF.
Need something bespoke? Our team builds it within one working day, with no code changes on your side.
Questions
Common questions.
Where do custom dashboards appear?
Inside MIE, under Custom dashboards in the same menu as Plant, Trends and Alerts. There is no separate tool to log in to.
Is the data live?
Yes. Dashboards read the same live plant data as the rest of MIE and refresh with it.
Can other people in my company see them?
You choose. A dashboard can stay private, be shared inside your company, or be pinned to wall mode.
See it on a real plant
Ask the demo plant your own question.
We'll walk you through MIE on a live plant in 30 minutes.
Or call +91 98288 93692 · +91 83174 54076 · info@thinklytixai.com